Infographic
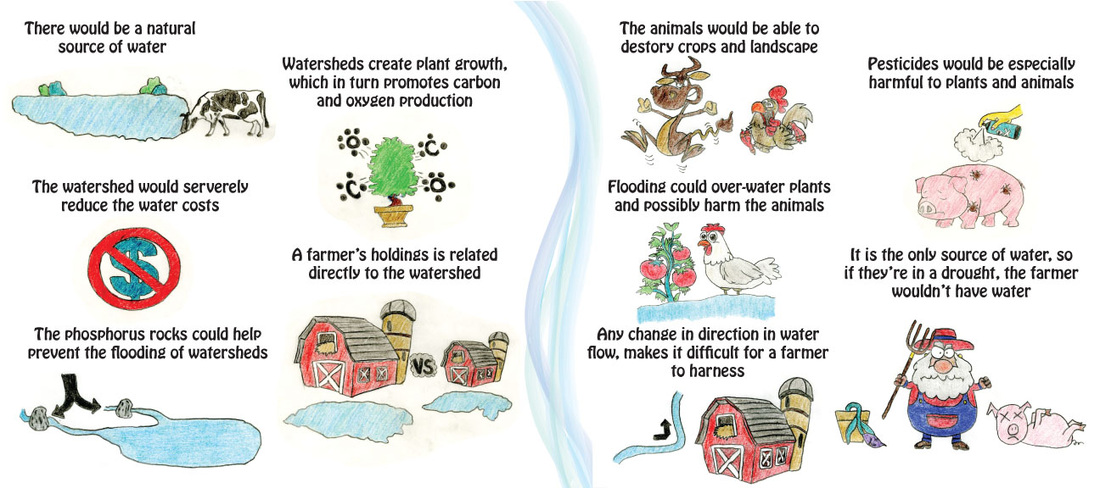
One of our mini-projects for our chemistry class was to make an infographic. You may be wondering, what is an infographic? Well, let me tell you. An infographic is a visual image that is modified to show information or data, in an 'artistic' piece. Based on our role-person that we were assigned within our groups for chemistry, we made an infographic to show the positive and negative affects a watershed has on our role-person. Within my group, I was assigned the role of a farmer, and my infographic shows the positive and negative affect a watershed has on a farmer. My finished infographic page is located below.