Mathematical Transformation
For my friend, Daisy and I, this was a shared project, so she did the linear part, and I did the non-linear part.
Data:
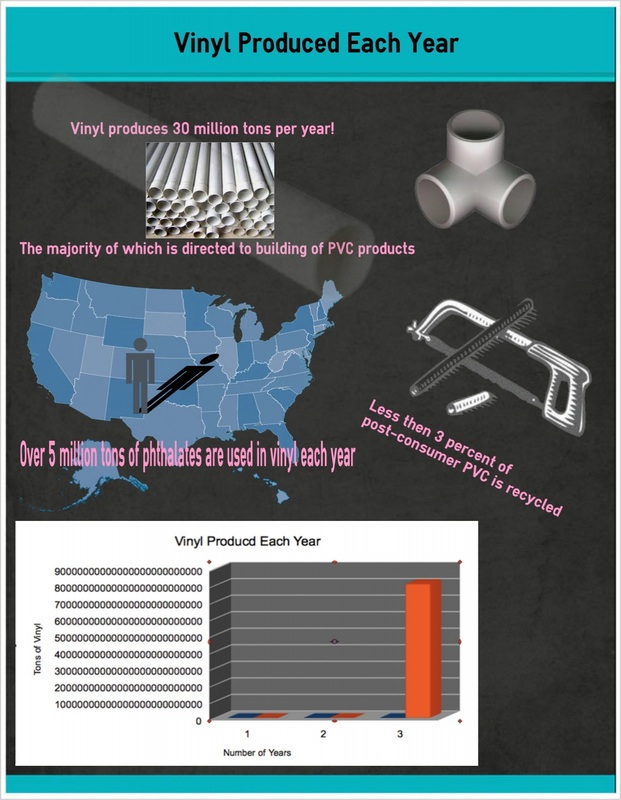
- Vinyl produces 30 million tons per year, the majority of which is directed to building applications, furnishing, and electronics.
- PVC is the largest use of chlorine gas in the world, PVC consumes about 40 percent of total chlorine product, approximately 16 million tons of chlorine are used per year world wide.
- Less than 3 percent of post-consumer PVC is recycled
- Over 5 million tons of phthalates are used in vinyl every year
To obtain this data, we had done research about PVC pipes, and found multiple sources, one source had the data below. It took a while to find information that had good numbers to use for data.
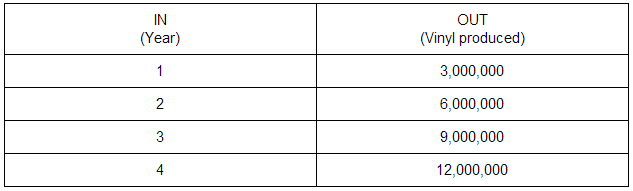
Linear table:
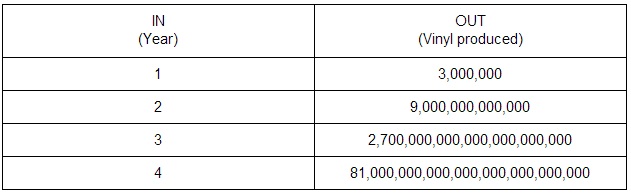
Non-linear table:
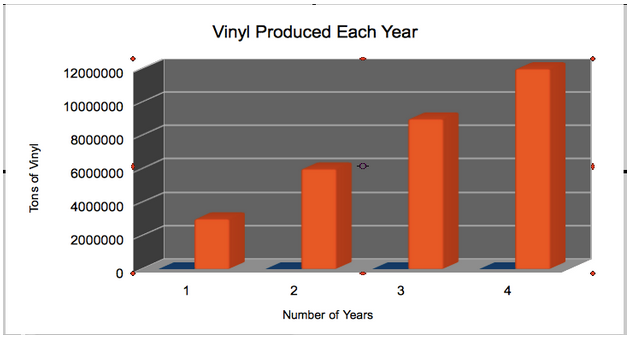
The linear graph is linear because the x and y axis increase at the same intervals.
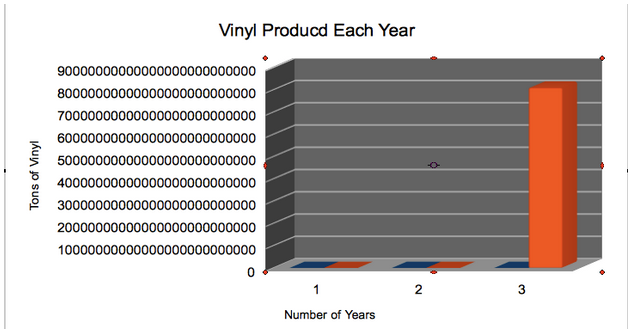
The non-linear graph is non-linear because it increases by more each year, instead of the same.
The non-linear graph is non-linear because it increases by more each year, instead of the same.
Linear graph:
Non-linear graph:
Three habits of a mathematician I've experienced throughout this project would be staying organized, being confident, and starting small. I feel like I've been a lot more organized with this project than anything else, only because the majority of it is online, but still I have to remember to save everything. I also feel like I've been confident because I am always hesitant that I did something wrong with my work, but for this project, I was really confident and excited to show everyone at exhibition. The last habit of a mathematician I feel I've accomplished for this project was starting small, because I've looked at a project as the "final product," but the way Ms. X divided this project into benchmarks helped me a lot.
My experience for exhibition night was amazing! I was really excited to show everyone my infographic, and telling them that it's basically boring data, remodeled in a way that looks interesting. I also told them the process that we went through to get to our final product. The people that I showed it to liked it a lot.
My experience for exhibition night was amazing! I was really excited to show everyone my infographic, and telling them that it's basically boring data, remodeled in a way that looks interesting. I also told them the process that we went through to get to our final product. The people that I showed it to liked it a lot.
